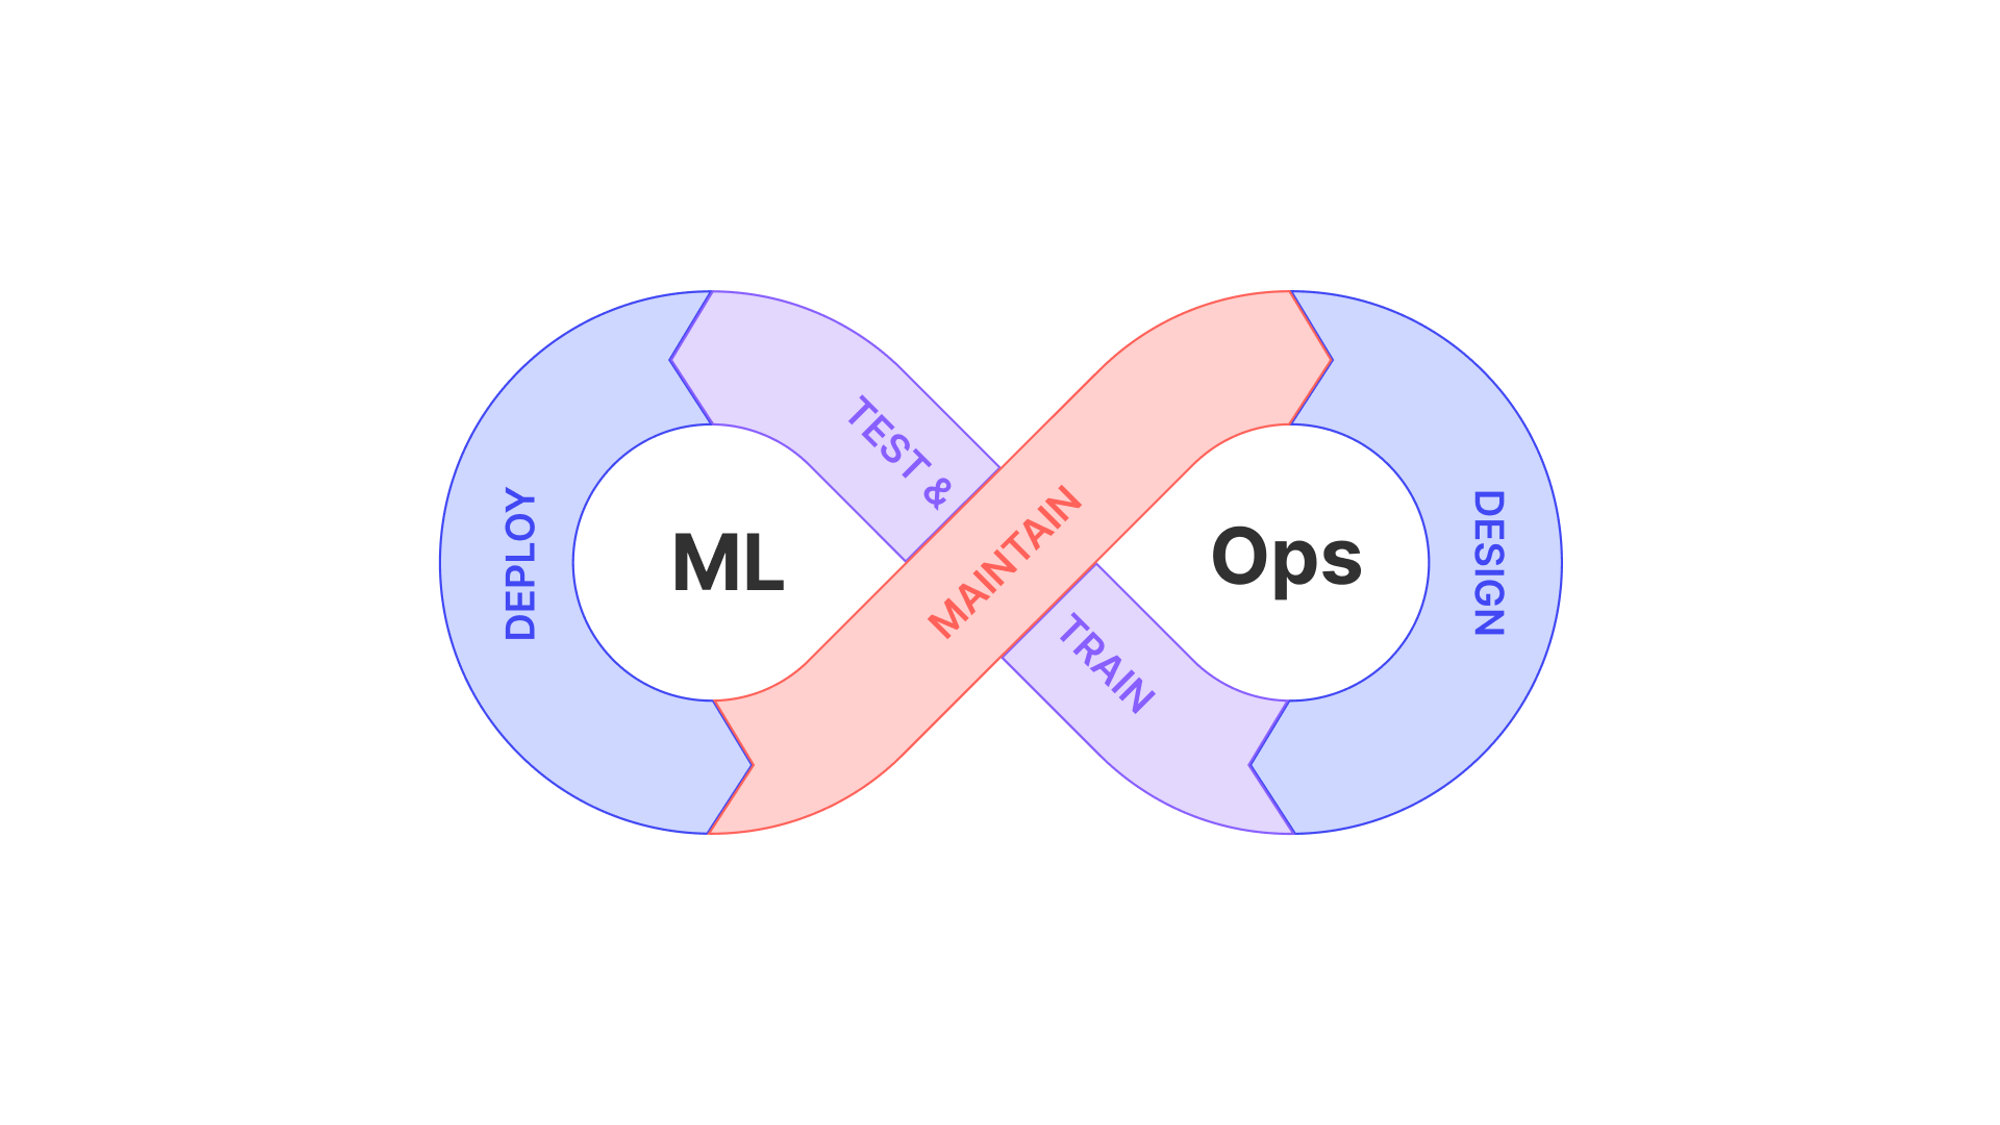
Computer vision is a rapidly growing field that holds the potential to transform industries by enabling machines to process and interpret visual information in a manner similar to humans. A crucial aspect of developing successful computer vision applications is data curation, the process of collecting, annotating, and organizing datasets used to train and evaluate models.
However, data curation presents several challenges that can hinder the development of accurate and robust models. One promising solution to these challenges is leveraging model diagnosis, a set of techniques that help identify and address issues in data and models to improve performance.
We Will Cover:
Understanding data and model architectures
Model diagnosis techniques and tools
Enhancing dataset relevance and coverage
Using the right diagnostic tools
Integrating curation with model assessment
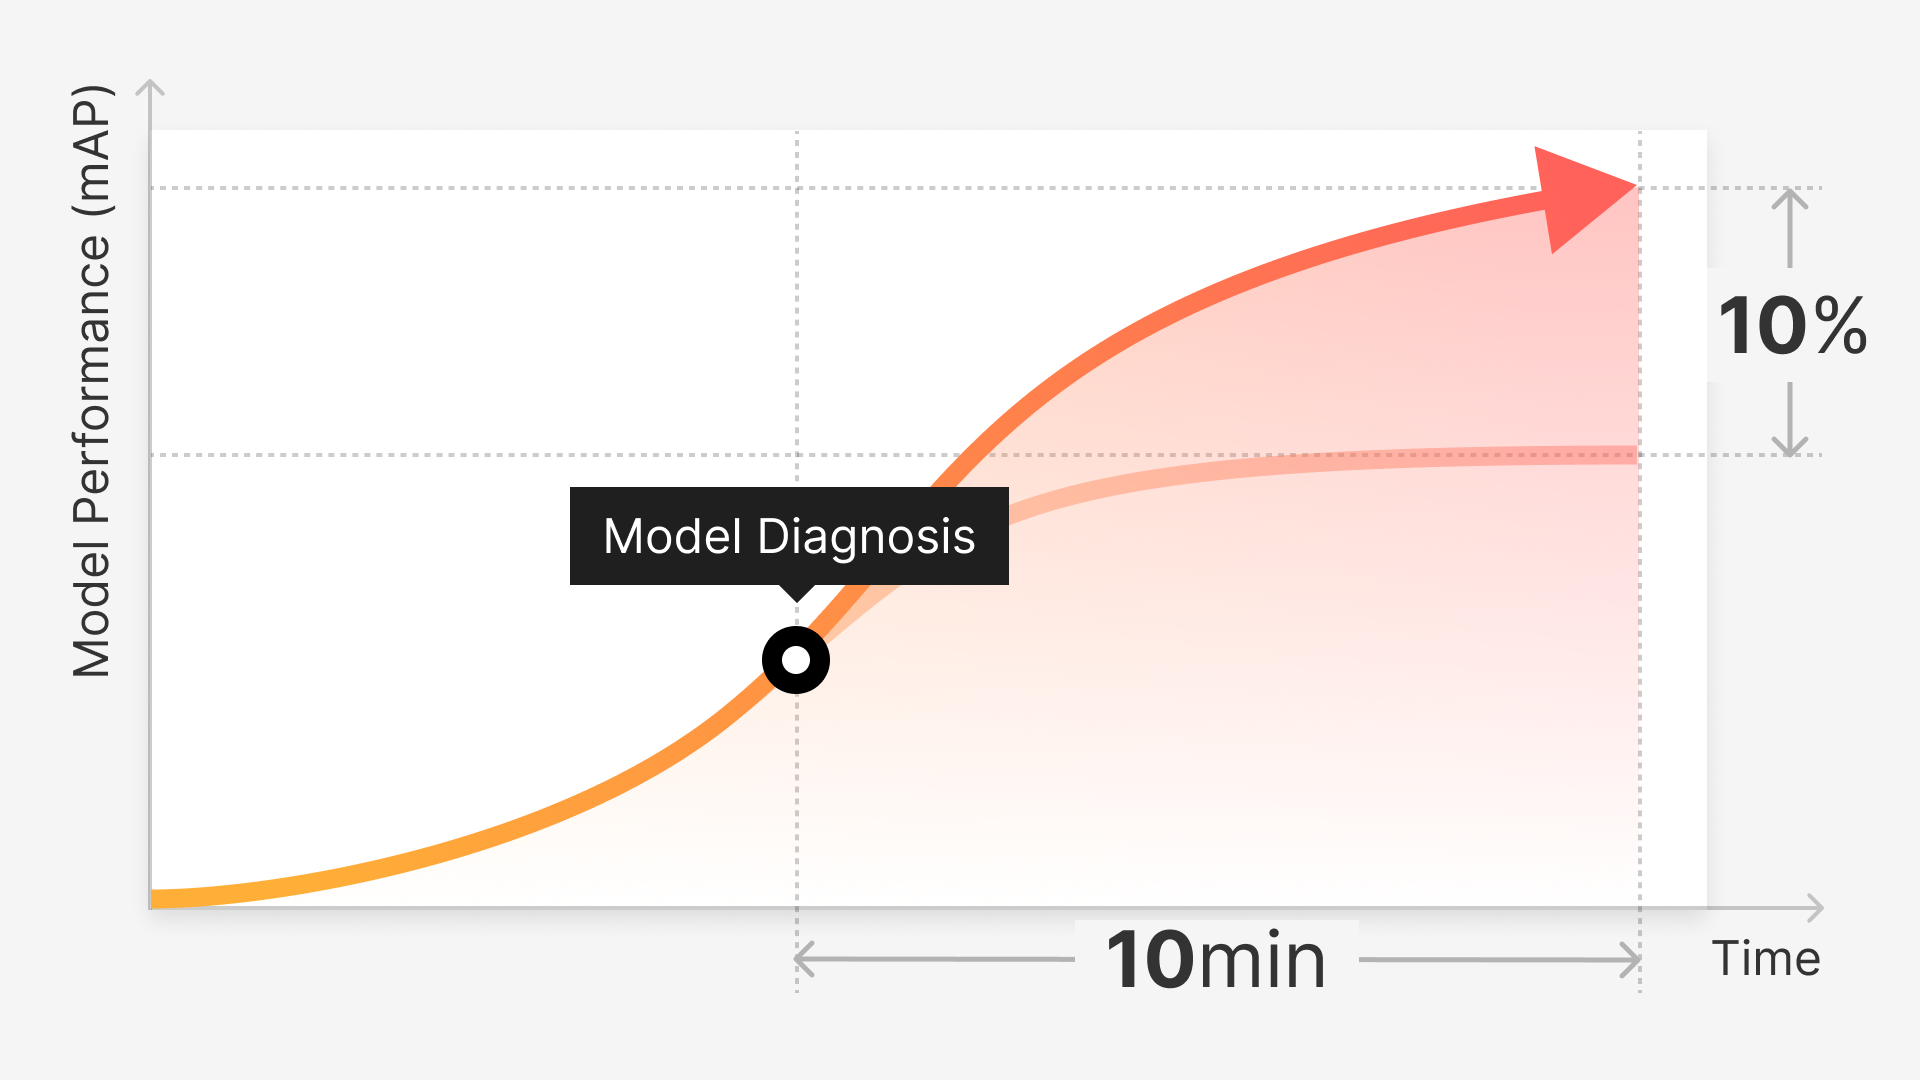
1. Model Diagnosis: An Overview
Model diagnosis refers to the process of systematically analyzing model behavior to identify and understand issues in both data and model architectures. It encompasses techniques such as error analysis, performance assessment, and visualization of model outputs, which help researchers gain insights into model limitations and areas for improvement.
Model Diagnosis Techniques and Tools
Confusion matrices: Visualizing the distribution of errors across different classes.
Activation maps: Analyzing the activation patterns of neurons in a model to understand what features are being learned.
Attention maps: Visualizing which parts of the input image are being focused on by the model.
Model-agnostic explanation methods: Generating explanations for model predictions that can be applied to various model architectures.
The Importance of Model Evaluation
Model diagnosis is crucial in computer vision as it helps researchers identify and address issues in data and models, ultimately leading to better performance, generalization, and interpretability of computer vision systems.
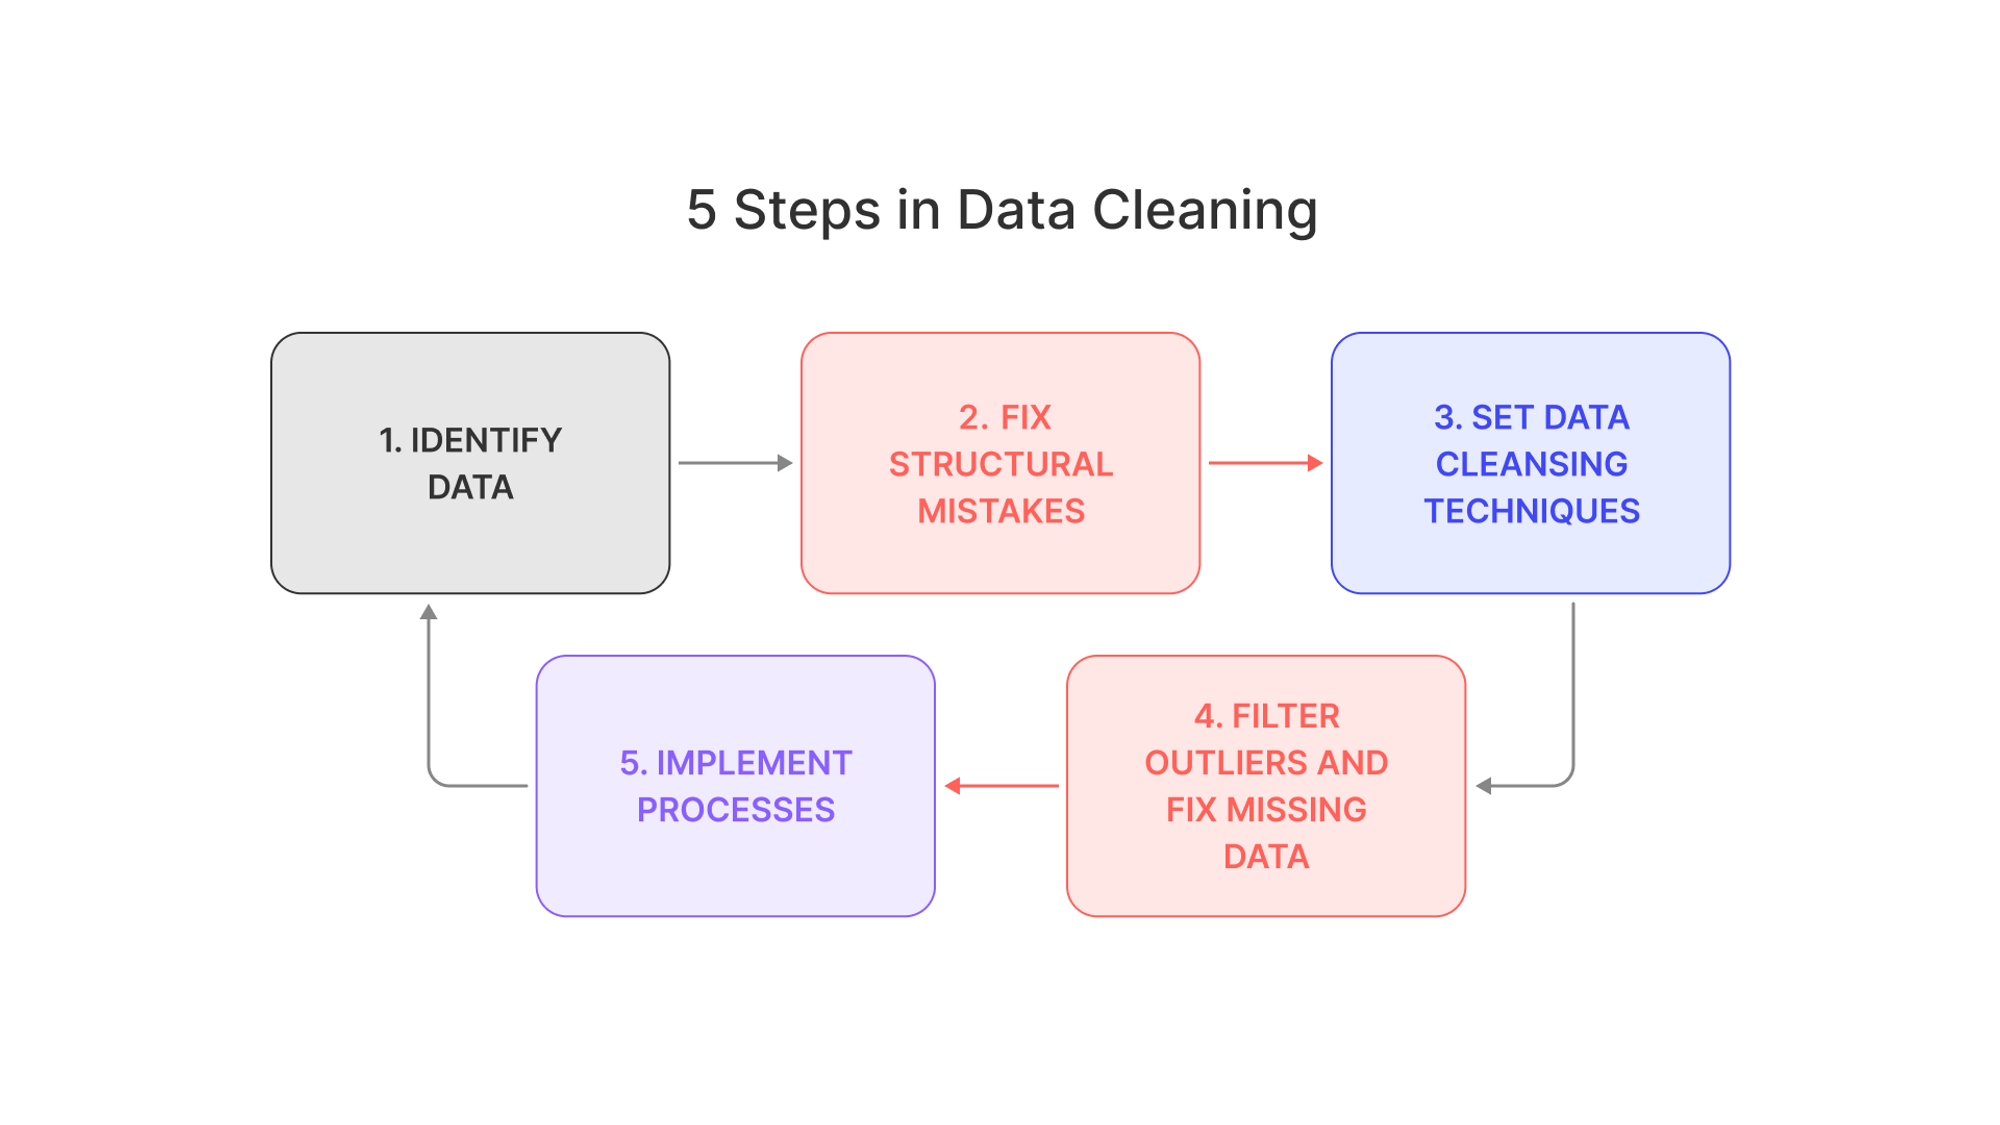
Data Curation Challenges in Computer Vision
Data Collection and Annotation
Collecting large-scale datasets for computer vision tasks is resource-intensive, often requiring manual annotation by human experts. Annotation errors or inconsistencies can negatively impact model performance and generalization.
Data Imbalance and Bias
Data imbalance occurs when certain classes or scenarios are over- or under-represented in the dataset, leading to biased model predictions. Additionally, datasets can contain unintentional biases reflecting cultural, social, or demographic factors, which can result in unfair or discriminatory model outcomes.
Data Quality and Consistency
Ensuring data quality and consistency across large-scale datasets is challenging, as images can have varying resolutions, lighting conditions, and backgrounds. Inconsistent data can lead to poor model performance and generalization.
Domain Adaptation and Dataset Shift
Dataset shift occurs when the distribution of data during model training differs from that during evaluation or deployment. Domain adaptation is the process of adjusting the model to accommodate these differences, which is essential for maintaining model performance in real-world scenarios.
2. Leveraging Model Diagnosis to Streamline Data Curation
A. Identifying and Addressing Data Issues
Reducing Annotation Errors
Annotation errors refer to inaccuracies in the labels assigned to training examples. For example, in a supervised machine learning context, if you're training an image classification model to recognize dogs, and some pictures of cats are labeled as dogs, this would be an annotation error.
Model diagnosis techniques, such as error analysis, can help identify these instances. By analyzing the instances where the model performs poorly, we might find that the problem isn't with the model but with the data. In our example, if the model consistently misclassifies images of a certain breed of dog, we might find that this breed was mistakenly labeled as a cat in the training data.
To address annotation errors, it's important to have a robust data validation process. This could involve manual review of a random sample of the data, or using statistical methods to identify potential outliers. In some cases, active learning techniques can be used, where the model's most uncertain predictions are reviewed and corrected, providing a targeted way to improve the dataset.
Detecting and Handling Data Imbalance
Data imbalance occurs when some classes are over-represented or under-represented in the training data. For example, in a dataset for binary classification of emails as "spam" or "not spam", if 95% of the emails are "not spam" and only 5% are "spam", this is a data imbalance.
Confusion matrices are a common tool for identifying data imbalance. They provide a detailed breakdown of a model's performance, showing the number of true positives, false positives, true negatives, and false negatives for each class. If the model's accuracy is high for the "not spam" class but low for the "spam" class, this could be an indication of data imbalance. Once data imbalance is identified, there are several techniques to address it. One is to gather more data for the under-represented class.
Alternatively, you could use resampling techniques, such as oversampling the minority class (creating copies of instances from the under-represented class) or undersampling the majority class (removing instances from the over-represented class). Another option is to use synthetic minority over-sampling technique (SMOTE), which generates new instances of the minority class.
Assessing Data Quality and Consistency
Data quality and consistency refer to the overall reliability and uniformity of your data. If your data has many missing values, outliers, or is labeled inconsistently, these are signs of poor data quality.
Model diagnosis can help identify data quality issues. For instance, if your model performs poorly on a certain subset of the data, there could be a data quality issue with that subset. In a text classification task, for instance, you might find that the model performs poorly on certain documents because they're full of typos or poorly formatted.
Addressing data quality issues typically involves refining your data preprocessing and augmentation techniques. This could involve cleaning up the data (e.g., removing or imputing missing values, correcting typos, etc.), standardizing the data (so that it's in a consistent format), and/or augmenting the data (e.g., by adding noise or applying other transformations to make your model more robust).
Data quality and consistency are fundamental to the success of any machine learning project. Without high-quality, consistent data, even the most sophisticated model will struggle to perform well.
B. Enhancing Dataset Relevance and Coverage
Identifying Underrepresented Classes
Underrepresented classes in a dataset can lead to a model that performs well on majority classes but poorly on minority classes. For example, in a sentiment analysis task, if the majority of the data is labeled as 'neutral' and 'positive', with very few 'negative' examples, the model might struggle to accurately identify negative sentiment.
Model diagnosis techniques can help identify these underrepresented classes. For example, a confusion matrix, as mentioned earlier, can reveal if a model is consistently misclassifying certain classes. Similarly, techniques like receiver operating characteristic (ROC) curves or precision-recall curves can provide insights into class-specific performance.
Once underrepresented classes are identified, additional data collection or resampling techniques can be used to improve the model's performance on these classes. For example, in the sentiment analysis task, we might actively seek out more examples of negative sentiment or use synthetic data generation techniques to create more negative examples.
Expanding Dataset Diversity
Dataset diversity is essential for ensuring that a machine learning model can generalize well to various scenarios and conditions. If a dataset lacks diversity, the model may be biased and perform poorly on certain types of data.
Model diagnosis can help identify gaps in dataset diversity. For instance, error analysis can reveal that a model is performing poorly on certain types of data. For example, a facial recognition model might perform well on light-skinned individuals but poorly on dark-skinned individuals, indicating a lack of diversity in the training data.
Once these gaps are identified, efforts can be made to collect more diverse data. In the facial recognition example, this could involve collecting more images of dark-skinned individuals. Additionally, fairness metrics can be used to monitor the model's performance across different demographic groups and ensure that it's not biased.
Addressing Dataset Shift and Domain Adaptation
Dataset shift refers to situations where the distribution of data changes over time or across different contexts. For example, a model trained to detect spam emails from 2010 might perform poorly on spam emails from 2023, due to changes in spamming techniques and language use.
Domain adaptation refers to the process of adapting a model to perform well in a new context or domain. For instance, a model trained on medical images from one hospital might need to be adapted to work well on images from a different hospital, due to differences in imaging equipment and techniques.
Model diagnosis can help identify instances of dataset shift and guide the domain adaptation process. For instance, if a model's performance suddenly drops, this could be a sign of dataset shift. Similarly, if a model performs well on one dataset but poorly on another, this could indicate the need for domain adaptation.
C. Streamlining Model Training and Evaluation
Improved Model Performance
Model diagnosis, by addressing data issues and enhancing dataset coverage, can significantly improve model performance. For instance, consider a model trained to recognize objects in images. If the model performs poorly, a diagnosis could reveal that it struggles with certain types of objects that are underrepresented in the training data. Gathering more data on these objects could then improve the model's overall performance.
Furthermore, model diagnosis can also help identify overfitting, where a model performs well on training data but poorly on unseen data. Techniques like cross-validation or examining the learning curves can help diagnose overfitting, and remedies like regularization, dropout, or gathering more diverse data can be used to address it.
Accelerated Development Cycles
Model diagnosis accelerates the model development cycle by enabling quicker identification of problems. For example, during the training of a natural language processing (NLP) model, if the model is consistently making errors in understanding the context of a conversation, model diagnosis can help identify this issue quickly.
Researchers can then decide whether to gather more contextual conversation data, adjust the model architecture, or apply different data preprocessing techniques, saving valuable time that might have been wasted on less effective solutions.
Moreover, model diagnosis can inform hyperparameter tuning, which is often a time-consuming part of the development cycle. By providing insights into how model performance changes with different hyperparameters, model diagnosis can guide the tuning process and help find good hyperparameters more quickly.
Enhanced Interpretability and Trust
Model diagnosis techniques can provide insights into a model's behavior and decision-making processes, enhancing interpretability and trust in the model. For instance, consider a medical diagnosis model.
If the model makes a prediction, doctors and patients would want to understand why it made that prediction. Techniques like feature importance analysis or model-agnostic interpretability techniques (like LIME or SHAP) can help diagnose which parts of the input are most influential in the model's decision.
For instance, in the medical diagnosis model, feature importance analysis might reveal that the model is paying attention to the right areas of a medical image when making a diagnosis. This not only helps improve trust in the model but also provides valuable feedback for further improving the model and the data it's trained on.
3. The Use of Clusterization
Clustering is a powerful technique that can aid both in model diagnosis and in data curation. Clustering algorithms group similar instances together based on their features. Visualization of these clusters can provide valuable insights into the structure of the data, the features that define these clusters, and potential issues with the data or the model.
For example, consider a model trained to classify images of different types of fruit. Using clustering and visualization techniques, we can group the images based on their features and visualize these groups. If some images of apples are grouped with oranges, this could indicate that these apples are somehow similar to oranges.
Perhaps they're red oranges, or the images were taken under unusual lighting conditions. This could suggest a problem with the data (e.g., these images are mislabeled or confusing) or with the model (e.g., it's not capturing the right features to distinguish apples from oranges).
Similarly, clustering visualizations can help identify underrepresented classes or scenarios. If we see that certain types of images form small clusters, this could indicate that these types of images are underrepresented in the data. Collecting more data on these types could then improve the model's performance on them.
The Link Between Clustering and Diagnostics
Clustering visualization and model diagnostics are connected in the sense that both involve understanding the structure and characteristics of the data, and how the model interacts with it. Both can provide valuable insights into the performance and behavior of the model, and both can guide the data curation process.
For instance, both can help identify data quality issues. If clustering visualization reveals that some instances are far away from any cluster, this could indicate that these instances are outliers or contain errors. Similarly, model diagnostics might reveal that the model performs poorly on these instances, suggesting a data quality issue.
Correcting Dataset Inconsistencies
By providing insights into the data and the model, clustering visualization and model diagnostics can significantly improve the data curation process. For example, they can guide the collection of new data, ensuring that it covers the right types of instances and scenarios.
They can also help identify and correct errors or inconsistencies in the data, improving data quality. They can also inform the design of data augmentation techniques, ensuring that these techniques are appropriate for the data and the model.
Moreover, clustering visualization and model diagnostics can enhance data annotation. They can help identify instances that are difficult for the model to classify, which might need more detailed or precise annotations. They can also inform the development of annotation guidelines, ensuring that the annotations are consistent and capture the right level of detail.
4. Embeddings and Model Diagnosis
In the context of model diagnosis or evaluation, embeddings can be particularly helpful. They can provide insights into what the model has learned, how it represents the data, and how it differentiates between classes or categories.
For instance, if we train a model to categorize news articles into different topics, we can use embeddings to visualize how the model represents these articles. If articles about similar topics are close together in the embedding space, this indicates that the model has learned a meaningful representation of the data.
If, however, some articles are far away from their corresponding topics, this might suggest a problem - perhaps these articles are mislabeled, contain unusual vocabulary, or are about a topic not adequately represented in the training data. Such insights can guide the data curation process, helping us improve the quality, diversity, and relevance of our data.
Embeddings in Clustering Visualization
Embeddings are also invaluable in clustering visualizations. The lower-dimensional space of embeddings often reveals natural clusters in the data, which can be visualized and analyzed more easily than in the original high-dimensional space.
For example, using the news articles example, once we've transformed the articles into an embedding space, we can apply a clustering algorithm to group similar articles together. Visualizing these clusters can provide insights into the topics covered by the articles, the relationships between different topics, and potential gaps in our data.
Embeddings in Data Curation
Embeddings play a crucial role in data curation, guiding the collection, annotation, and validation of data. For example, if embeddings and clustering visualizations reveal that certain classes or scenarios are underrepresented in our data, we can focus our data collection efforts on these areas.
If they reveal that certain instances are far from any cluster or are in the wrong cluster, we can review the annotations for these instances, correcting any errors or inconsistencies. If they show that our data contains many overlapping or ambiguous instances, we can refine our annotation guidelines to capture more detail or precision, helping our model differentiate between these instances.
Moreover, embeddings can help us design more effective data augmentation techniques. By understanding how our model represents the data, we can create augmentations that mimic the variations and perturbations in the embedding space, improving the robustness of our model.
Integrating Diagnosis and Development
Model diagnosis plays a crucial role in streamlining data curation for computer vision applications. By identifying and addressing data issues, enhancing dataset relevance and coverage, and improving model training and evaluation, model diagnosis contributes to more accurate and robust computer vision systems.
Embracing a collaborative approach between researchers, practitioners, and other stakeholders will be vital to leverage the benefits of model diagnosis in computer vision fully. Sharing insights, best practices, and lessons learned will foster innovation and accelerate the development of cutting-edge solutions for complex real-world problems.
As the field continues to evolve, the integration of model diagnosis with other data curation techniques and the development of automated tools will be essential for further advancements in computer vision research and applications, paving the way for more intelligent, efficient, and trustworthy AI systems.